The New Default. Your hub for building smart, fast, and sustainable AI software
Table of Contents
and 6 more
Data visualization best practices follow one order of work: decide the question a chart has to answer, choose the data that answers it, pick the chart type that fits, then design the labels, hierarchy and highlights so the reader gets the answer without help. Dashboards inside a product raise the stakes, because nobody stands next to the chart to explain it.
Our product design team designed the interface for Databout's spatial-analysis application, a map-centered tool for an infrastructure engineering consultancy. The practices below draw on that kind of work.
Executive Summary
A dashboard works when each chart answers one stated question, and the reader can see the answer without asking anyone. Get there in order: question, then data, then chart type, then annotation, hierarchy and highlighting. Plan accessibility from the start, since WCAG 2.2 sets contrast rules for chart lines and the European Accessibility Act now covers banking and e-commerce services. Adoption is the outcome to measure. A year after delivery, Databout was still using 90% of the interface we designed.
What Does an Unclear Dashboard Cost a Software Business?
When a chart leaves its reader guessing, the analysis falls back on the user, who can export the numbers into a spreadsheet or stop opening the feature. Either way, the money spent building it stops paying back. Digital-adoption vendor WalkMe's State of Digital Adoption 2025 research, based on a survey of 3,700 senior executives and employees plus WalkMe's own usage data, puts the average large enterprise's loss from digital inefficiencies at $104 million a year.
That figure covers enterprise software in general, and our analysis of the hidden costs of bad UX in enterprise software cites it too. An unreadable reporting feature is one of the ways software ends up underused.
Option | What the user gets | Who does the analysis | Where it breaks |
|---|---|---|---|
Raw table or CSV export | Every value, in rows | The user, in a spreadsheet | Patterns and outliers stay buried in the rows |
Default library charts | One chart per metric, styled by the library | The user, comparing charts by eye | Every metric gets equal weight; colors and legends follow library defaults |
Question-first dashboard | Charts tied to stated questions, with labels and highlights | The product team, before release | Needs design and domain-expert time up front |
The third option costs more before launch, while the first two hand that cost to every user each time they open the screen.
How Does Question-First Design Change What Users Do With Data?
In Data Points: Visualization That Means Something, Nathan Yau answers the worry about drowning in data by pointing out that data can be filtered and aggregated; the real work is digging deeper into the part that matters.
For a product team, that work starts with an exploration phase before any chart exists: check what data you have, what you want to know about it, which visualization methods fit, and whether what you see makes sense. Decide early whether the reader needs the best or worst performers, a comparison between specific data points, or a trend over time.
The exploration phase also changes the brief. A dashboard ticket that reads "show revenue" gives a designer nothing to test against; one that names a decision, such as which region missed its target this quarter, lets every review check the chart against that decision.
Databout's application, whose interface we designed, prioritizes what users need to see. The map is the focal point, sliders and manual inputs set the analysis parameters, and the results tables were designed so the most important outputs are visible at once.
How Do You Choose the Right Chart Type for a Dashboard?
Once the question and data are fixed, the chart type mostly follows. The Financial Times' Visual Vocabulary groups chart types by the relationship in the data.
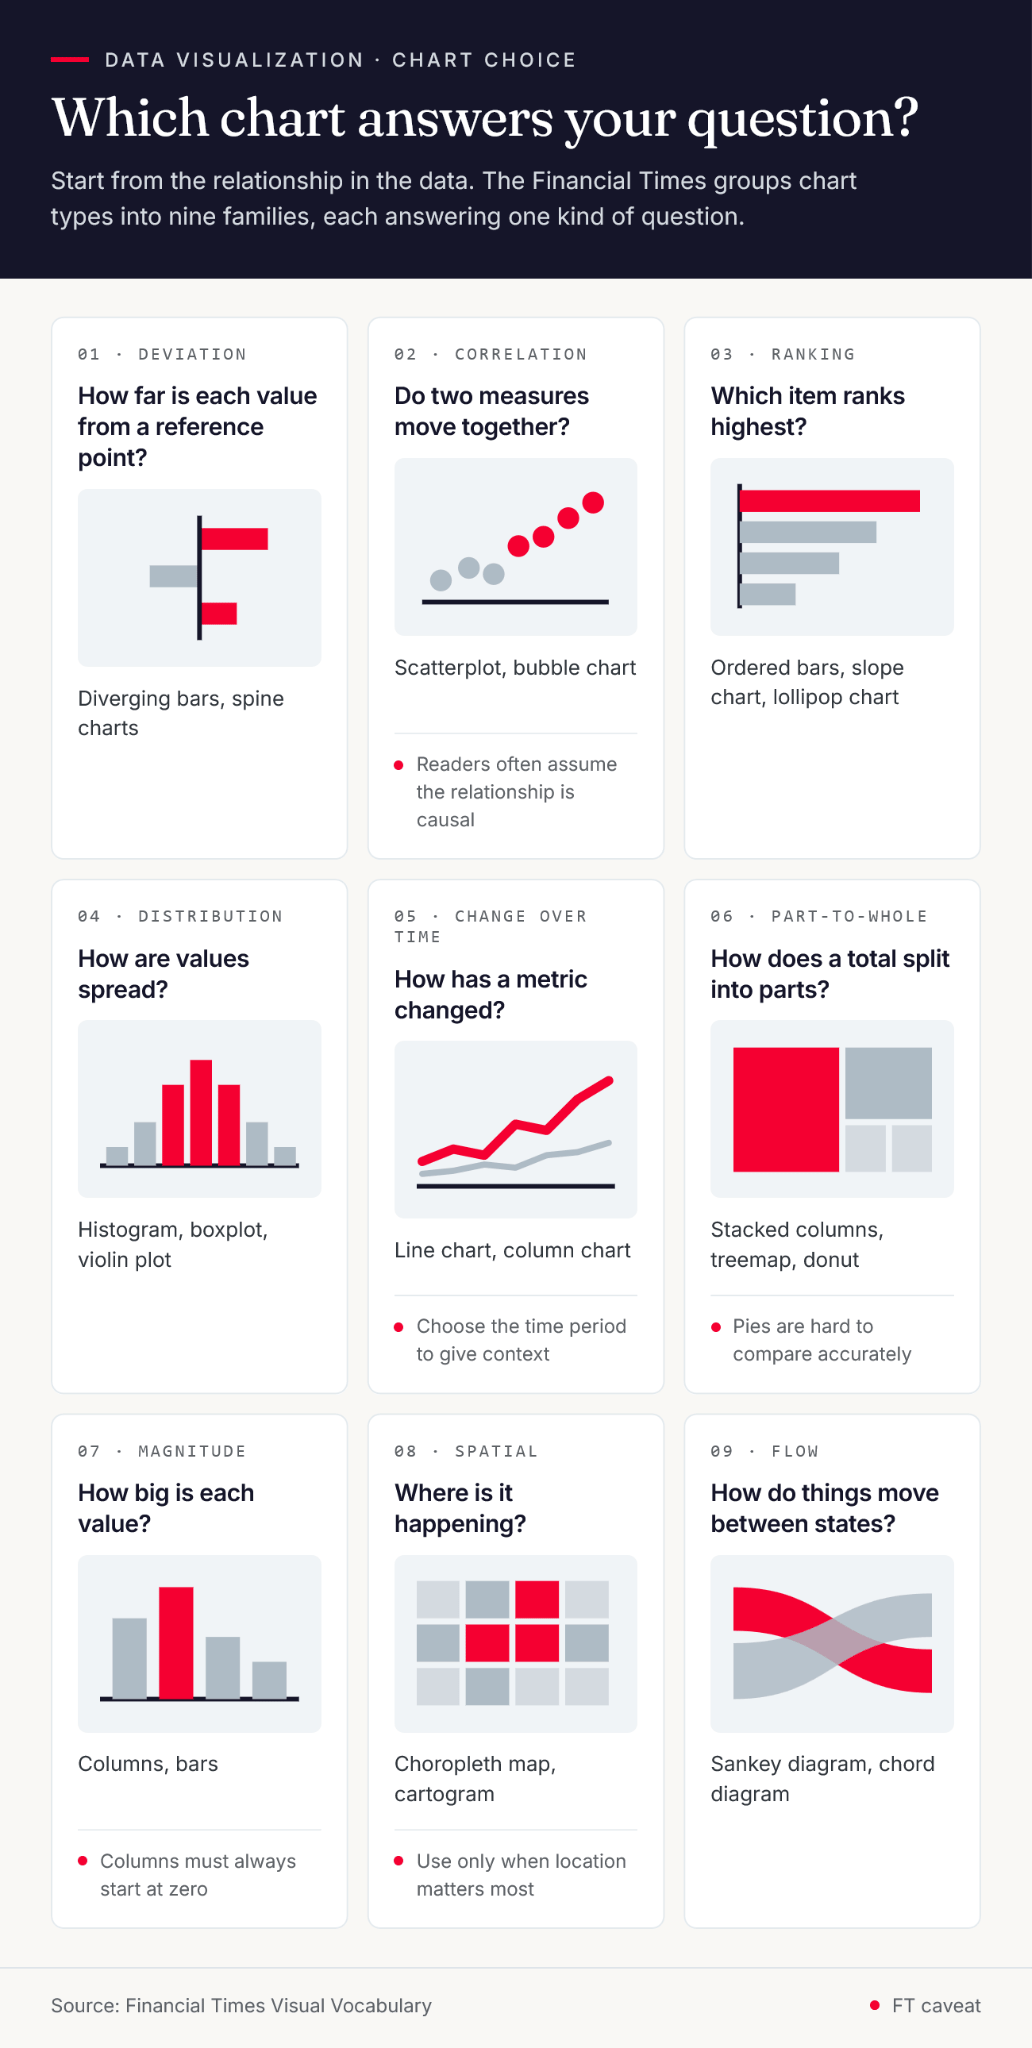
Question the chart answers | FT category | Chart types to consider | FT caveat |
|---|---|---|---|
How far is each value from a reference point? | Deviation | Diverging bars, spine charts | – |
Do two measures move together? | Correlation | Scatterplot, bubble chart | Readers often assume the relationship is causal |
Which item ranks highest? | Ranking | Ordered bars, slope chart, lollipop chart | – |
How are values spread? | Distribution | Histogram, boxplot, violin plot | – |
How has a metric changed? | Change over time | Line chart, column chart | Choose the time period to give context |
How does a total split into parts? | Part-to-whole | Stacked columns, treemap, donut | Pies are hard to compare accurately |
How big is each value? | Magnitude | Columns, bars | Columns must always start at zero |
Where is it happening? | Spatial | Choropleth map, cartogram | Use only when location matters most |
How do things move between states? | Flow | Sankey diagram, chord diagram | – |
For changes over time, Nathan Yau's interactive on the changing American diet is a worked example: each chart is a time series for a major food item, so each small chart answers one question.
On a dashboard, give every chart one question, and split any chart that tries to answer two.
How Should You Label and Annotate Dashboard Charts?
A chart in an article has paragraphs around it. A chart on a dashboard has its title, its axis labels and whatever annotations the designer added, so those elements carry the whole explanation. Write the title as the answer or the question it settles, and use a subheader for units and date range.
Annotations put context on the chart itself. A line or arrow can point at the outlier, and a short note can explain a dip before anyone files a ticket about it. Label lines and bars directly where space allows, so the reader doesn't travel between the data and a legend.
Typography should stay out of the way. Simple sans-serif fonts keep chart text legible, and tabular figures line numbers up so they can be compared at a glance.
When space runs out, tooltips hold the detail that doesn't fit, and filters or drill-downs let one chart serve several audiences. Every interaction is something a user has to discover, so the default view should answer the main question before anyone hovers or clicks.
Test that default view with real users before release. Ask each one what the chart tells them and compare the answer with the question in the brief; a mismatch is cheaper to fix in a prototype than after launch.
How Do Visual Hierarchy and Highlighting Guide Attention on a Dashboard?
Visual hierarchy is the order in which a reader notices things. Brent Dykes defines data storytelling as "a structured approach for communicating data insights", and on a dashboard with no narrative around it, hierarchy has to carry much of that structure. Rank every element on the dashboard by importance, from the headline metric down to supporting detail, then express that ranking through:
size and scale, since bigger elements read as more important
color and contrast, since bright colors get noticed first
typography, with bigger and bolder type read before small print
position and spacing, since an element standing apart from a group draws the eye
Visme's guide to visual hierarchy covers these in more depth. Placement matters too: Chris Bank's guide to web UI visual hierarchy describes the F-pattern, which starts with a scan down the left side, and the Z-pattern, which starts with a scan across the top. Both put the top-left of a dashboard first in line, so that is where the headline metric belongs.
Highlighting applies the same ranking to the data. Give the series that answers the question a bolder or brighter color, without going overboard, and push the rest back with lighter tones; thicker lines and borders do similar work. Each new highlight competes with the ones already there, so check it against the ranking before it ships.
How Do You Keep Dense Dashboard Data Readable?
Turning a table into lines, bars, or dots lets readers see how values relate, provided the marks differ enough. Use length as a visual cue, keep enough contrast between series, and pick hues that people with color vision deficiency can still tell apart.
Context gives the marks their meaning. Election maps use party colors because readers already know them, and Datawrapper's Lisa Charlotte Muth sets out the rule for newsrooms: "The colors should be consistent across all newsrooms, to not confuse readers." Inside a product, that means a red that signals overdue on one screen can't signal growth on the next. Her 2018 guide to party colors also shows where a convention stops helping. Writing about Germany at the time, she noted that "The two biggest parties in the country, SPD and CDU, both have almost the same red as their logo color", and suggested political colors in their place.
Clutter works against readability at any scale. Packing many marks into a small area hides the pattern, so leave negative space around charts and between series, and cut gridlines and decoration that carry no data. Our case study for the packet analyzer platform whose interface we built for network engineers describes the result in similar terms: "a user-friendly interface that simplifies complex network data".
Chart.js vs Apache ECharts for Large Dashboard Datasets
The charting library sets how much data a dashboard can draw and how much accessibility work lands on your team. Our comparison of 15 JavaScript data visualization libraries recommends Chart.js for standard dashboards and Apache ECharts once datasets run into millions of points. As of November 2026, the latest releases are Chart.js 4.6.1 and Apache ECharts 6.1.0. The vendors' documentation describes each library this way:
Criterion | Chart.js | Apache ECharts |
|---|---|---|
Rendering | HTML5 canvas | Canvas or SVG; SVG reduces memory cost on mobile (ECharts features) |
Large datasets | Described as very well suited to large datasets (Chart.js documentation); offers decimation for line charts before rendering and rendering in a web worker (performance guide) | Incremental rendering for millions of data points, plus streaming that draws before the full dataset loads |
Screen readers | Canvas content isn't accessible to screen readers by default; you add | Generates chart descriptions automatically, but the feature is off by default (ARIA handbook) |
Both libraries document trade-offs. ECharts notes that this many data points is usually very memory intensive and offers TypedArray support to reduce memory use. Chart.js worker rendering frees the main thread, but DOM-dependent plugins and mouse interactions are likely to fail inside the worker. Since version 5, ECharts can also apply decal patterns, enabled through its ARIA options, which separate series by texture as well as color for readers with color blindness.
What Constraints Shape an In-Product Dashboard Build?
Accessibility and compliance
WCAG 2.2 applies to charts directly. Success criterion 1.4.1 (Level A) says color is not the only visual means of conveying information, so a red-or-green status also needs a label, icon or pattern. Criterion 1.4.11 (Level AA) sets a contrast ratio of at least 3:1 for graphical objects against adjacent colors, and the W3C lists "the important parts of a more complex diagram such as each line in a graph" among them.
In the EU, the European Accessibility Act came into effect in June 2025 and covers, among others, banking and payment services and e-commerce platforms. Check with legal review whether your dashboards fall in scope. Timing creates the friction here, because contrast and color encoding live in the chart theme, and changing a shared theme after release touches every chart that uses it.
Domain logic ownership
A dashboard is only as correct as the calculations behind it, and those usually belong to domain experts. On Databout, we owned the UX and UI while Databout's own experts built the backend algorithms. That split needs a shared definition of every metric before design starts, or designers end up polishing charts for numbers the domain team later redefines.
Where aggregation happens
If the API returns raw events, the browser does the summarizing, and every user pays for it in payload size and rendering time. Chart.js can decimate line charts in the browser, but sending fewer points from the API is a backend decision, and it belongs in the API contract.
Key Takeaways
Start each dashboard chart from a stated question and the data behind it, then pick the chart type the FT Visual Vocabulary matches to it.
Dashboard charts explain themselves: answer-style titles, direct labels, annotations and tooltips replace the paragraphs an article would provide.
Rank elements by importance and show the ranking through size, contrast and position, adding highlights only where they keep that order.
WCAG 2.2 requires a contrast ratio of at least 3:1 for chart lines and other graphical objects, and color can't be the only signal.
Databout was still using 90% of the interface Monterail designed a year after delivery; sustained use is the outcome to measure.
Making Dashboard Clarity a Product Decision
Data visualization is often treated as a design challenge, yet data and its meaning come before aesthetics and user experience. If the team building a dashboard can't connect the dots while creating its charts, users won't either.
Clarity depends on who is accountable for it. Somebody has to own the question each chart answers, somebody has to define the metrics behind it, and the chart theme has to meet contrast and color rules before the first screen is built. Library choice follows from data volume, and aggregation follows from the API contract. Those decisions are made in planning, and testing the default view with real users is the earliest way to learn whether the questions were right.
For products whose reporting features aren't being used, our product discovery work, which covers user research and usability testing, is a practical place to start.
Data Visualization FAQ

Karolina Kurcwald
Content Writer

Karolina helps brands, entrepreneurs, and job candidates stand out with messaging that clearly communicates their value and resonates with their target audiences. She is a messaging strategist and copywriter, helping B2B tech brands promote and sell their products and services online, around the world.